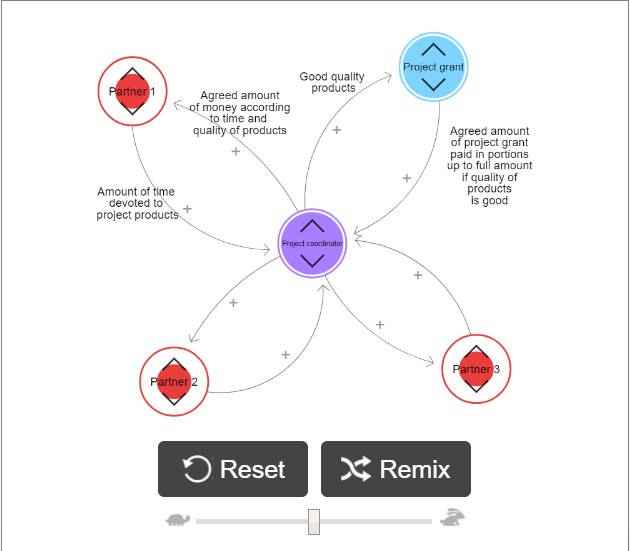
I have been experimenting with LOOPY as a way of showing a system.
My chosen system is project work. Therefore the animation below shows that a finite project grant stock is given to the project coordinator. Then three partners get fractions of that grant depending on the amount of time they put in and the quality of the products they produce. This is obviously a simple tool that can mainly be used for prompting a conversation rather than to make detailed plans and predictions. For a more sophisticated tool InsightMaker may be preferable but has a steeper learning curve.
One addition I considered was adding a bad relationship between two of the partners as this may reduce productivity!
Drawing a systems diagram could help us to construct a more accurate story for storytelling learning as recommended for sustainability approaches by the UN free online course on sustainability for general teachers.

